Optimizing San Diego MTS
Data Science · Python, Git, MySQL, Simulated Annealing
Overview
AllTransit, a tool that combines transit data with census data to flag underserved areas, marks the University Heights and North Park neighborhoods of San Diego as a transit gap: an area with poor access to public transportation despite a largely low-income population. The median income in the area is roughly $57,000, well under the $93,000 threshold used to define low income for a family of three in San Diego. Our team set out to improve service for this area by redistributing existing bus departures toward the stops that serve the lowest-income, highest-population block groups, while keeping the top 80th percentile of block groups at a minimum of one departure every ten minutes, and by planning a new route to help deliver AllTransit's recommended nine additional departures per hour.
Assigning Importance
To redistribute departures, we first needed a way to rank how much service each block group in the area deserved. We normalized each block group's income and population and passed the combined weights through a softmax function to produce an "importance" score. That score was split evenly across the stops in each block group and multiplied against the total number of daily departures to determine each stop's new share.
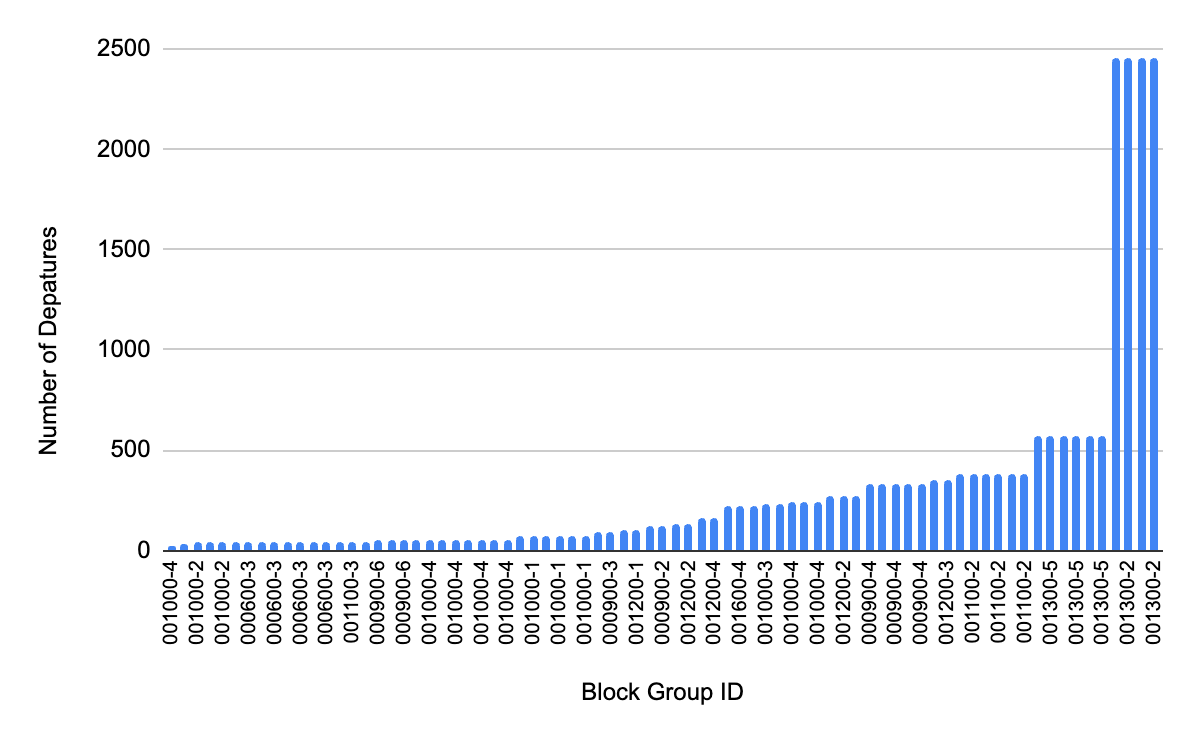
1st attempt: raw softmax output
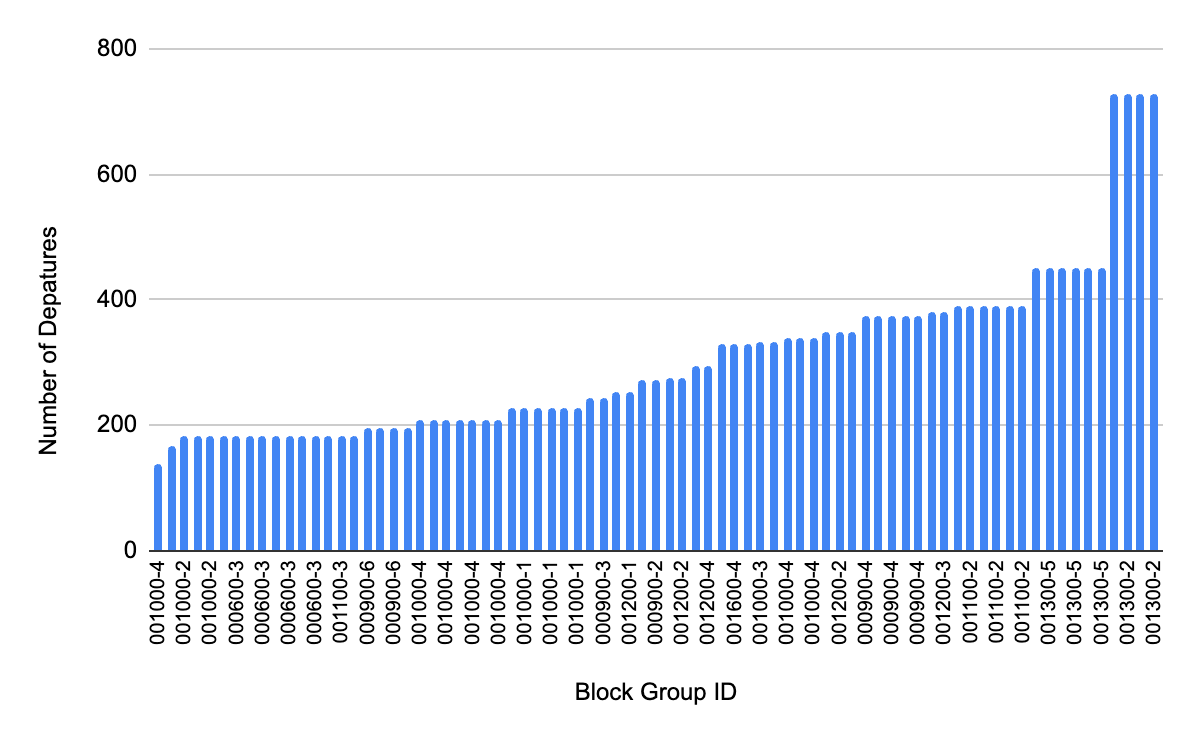
2nd attempt: temperature-adjusted softmax
Our first attempt revealed how heavily softmax weights larger values: a handful of stops ended up with over 2,000 projected departures a day while others sat around 30, far from the even redistribution we wanted. We fixed this by introducing a temperature hyperparameter that flattens the softmax distribution—the higher the temperature, the more uniform the output. We tuned the temperature until the top 80th percentile of block groups by importance maintained at least one departure every ten minutes, which occurred at a temperature of 3.
Results
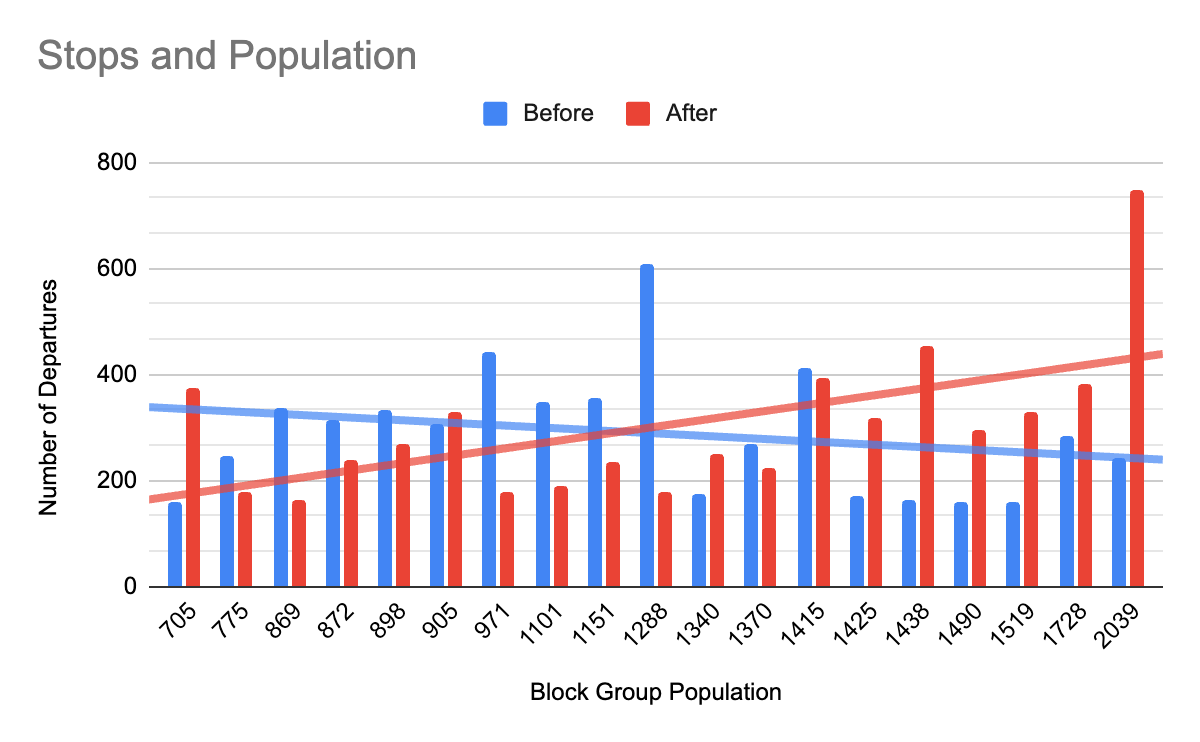
Population vs. departures, before vs. after
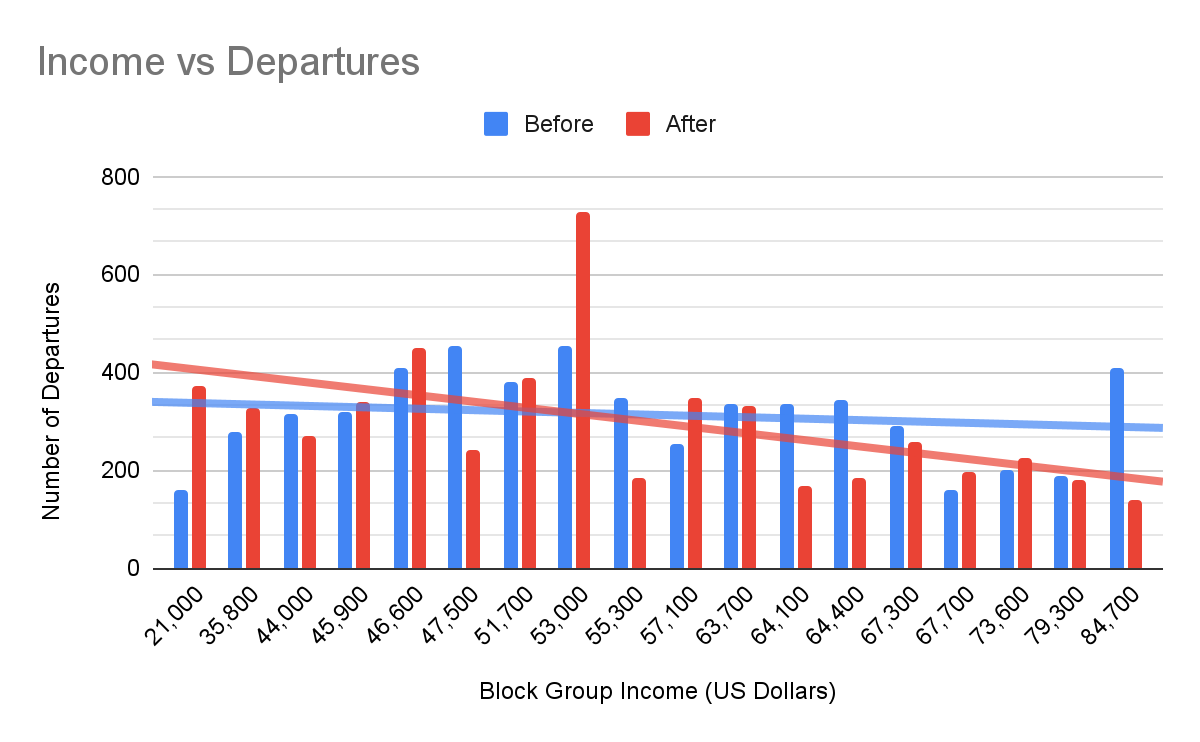
Income vs. departures, before vs. after
The before/after trendlines show the redistribution working as intended: departures shift toward higher-population block groups and toward lower-income block groups after optimization, reversing San Diego's roughly flat existing allocation. Each chart has one notable outlier—in the population chart, a block group of only 705 people receives an outsized share of departures because it also has the lowest median income in the area ($21,000); in the income chart, that same effect appears in reverse for a block group that is comparatively high income but also one of the most populous in the dataset.
Route Optimization
With the ideal departure distribution determined, we still needed a way to physically deliver AllTransit's recommended nine additional departures per hour, which meant designing a new route connecting all of the area's bus stops. Finding the most efficient path through a set of stops is the classic Traveling Salesman Problem, which we approximated using simulated annealing—an algorithm modeled on how metal atoms settle into a low-energy arrangement as they cool. We built on Matthew Perry's simanneal Python package, with one key change: computing Manhattan rather than Euclidean distance between stops, since decomposing distance into horizontal and vertical components produced a route that mirrors San Diego's grid-like streets far better than a straight-line approximation would.
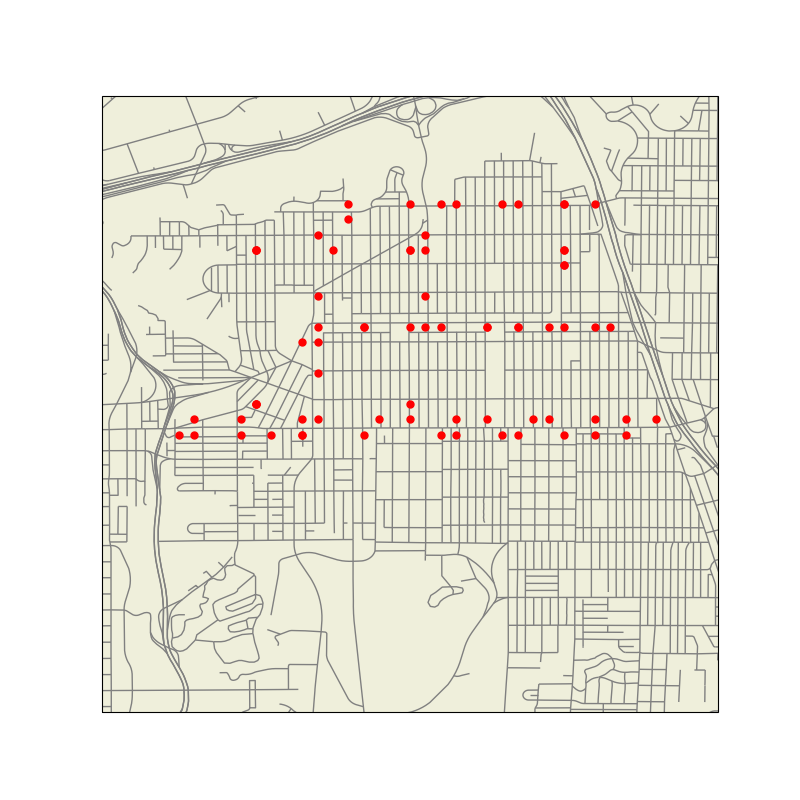
All stops in University Heights / North Park
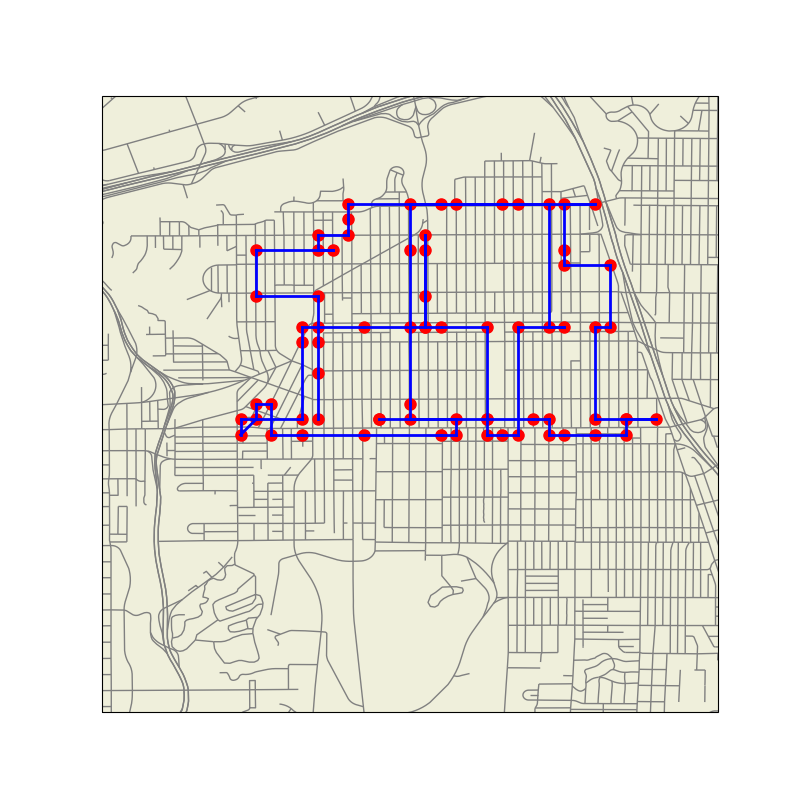
Simulated annealing route solution
The resulting route is an approximation and doesn't follow physical streets exactly, but it's a strong signal for which corridors a new line should be built along. Paired with the redistributed departure schedule, this route would let San Diego MTS put its existing resources to more efficient use in support of the area's lowest-income, most transit-dependent communities.
Impact
This project won 1st place among 14 teams at the UCSB Data Science Project Showcase. I owned requirements definition and project planning for our 5-person team, ran weekly group meetings and delegated tasks across members, and led implementation and testing of the redistribution and route-optimization pipeline—keeping the group on track from problem scoping through the final presentation.